New year, new blog post!
So as the new year starts, one of my new year’s resolutions is to put more time into developing my blog post. I have to admit, that after my first post it suffered a bit of neglection. 2018 has been a great but also busy year for me, giving me the opportunity to spend my time on great experiences but also forcing me to compromise on some of my other projects. So here we are, new year, new opportunities for my blog page! 🙂
I want to start the new year with a US stock market outlook, after a financial year which I think has been quite a challenging one. With major stock indices such as the Dow Jones, S&P 500 and Nasdaq 100 correcting quite substantially during the last quarter 2018, the question that many investors ask themselves this year is which direction will stock markets take in 2019?
Wall Street’s Opinion
Looking at the year-end publication of major wall-street strategists (Strategists Forecast 2019 – Yahoo Finance) they take on a quite diverse view on US stock market outlook 2019. The S&P 500 2019 year-end target price range reaches from $2,750 to $3,350. This resembles an 8.5% to more than 32% growth rate as compared to the current price (somewhere around $2,532). While this range is remarkable, it is even more remarkable to note that all banks seem to expect stock market growth in 2019. How can they be so sure, right after December 2018, which has been the worst month for S&P 500 since 10 years (losing around 9% within one month) ? Let’s take a closer look if we can share their opinion.
Stock Market Situation – The Good, the Bad and the Ugly
The Good
A lot of the story from last year has been around whether or not US stocks are overpriced. This was due to the fact that many people, when looking at stock prices and valuation, they look at PE ratios and PEG ratios (i.e. price-earning and price-earning to growth-ratio), noting that these have been marking historical highs for US stocks during the last years. From that they draw the conclusion that US stocks are overpriced.
When confronted with this argument, I usually note that one should not only take a look on simple PE or PEG ratios alone, because it leaves out an important component of valuation. And this is interest. Since the aftermath of the financial crisis in 2007, the FED rate in the US marked historical lows at around 0%, from which it gradually started to recover since the end of 2015. Now the FED rate is at 2.5%, which is still low historically (also take a look at FED Rate for more details on this). So given low funding rates, market liquidity has been high, which in turn drove up demand for stocks and stock market valuations. Now, how do we find a more reliable source of valuation, given that PE and PEG ratios do not seem to be that accurate. A concept which has proven to be of help for me is the FED model. For that, let’s take a look at below graph:
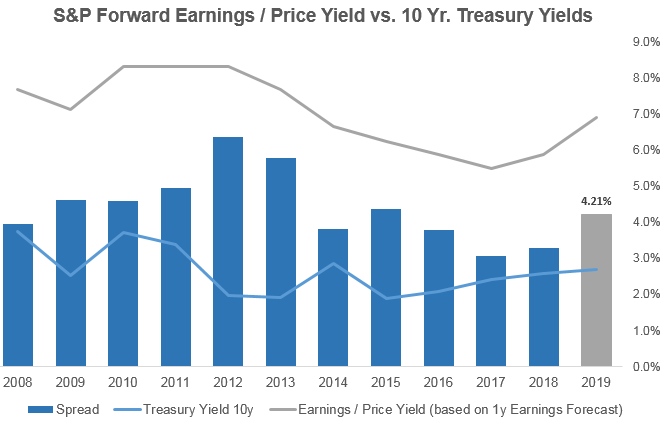
It basically shows the development of the Earnings / Price-ratio of the S&P 500 (which is basically the inverse of the PE ratio, using 1y analyst earnings forecasts in this case), which is nothing else than the 1-year expected yield of the S&P 500. In addition, it shows the development of 10y US Treasury yields as well as the spread between these two metrics. For valuation purposes we want to look at the spread.
The reason why we look at the spread between those two is standard CAPM theory, i.e. Finance 101. With US treasuries resembling a risk-free investment, and the S&P 500 resembling a market portfolio, the spread between those two resembles the market risk premium. Based on the assumption that this should not change too much over time, one can derive from high fluctuations that stock market valuation may be too high (i.e. if the spread is too low, S&P earnings-yield in relation to Treasury yield is too low) or viceversa. We can see that after the substantial market downturn at year-end 2018, now the spread has recovered to its average / median level since 2018. I.e., from this metric it seems that S&P 500 stocks are fairly valued at the moment. Which is good!
Now one may argue that this is nice, but the spread shown above may have been distorted by wrong earnings expectations from analysts. What if actual earnings will be lower than what analysts expect now, then the true spread would also be much lower than shown in above graph, meaning that stock prices would still be overvalued. Taking a look at analysts S&P 500 earnings growth expectations 2019, it looks like that analysts corrected down their expectations quite substantially during 2018 from around 17% to now 7.5%. This correction is already priced into the current S&P 500 valuation and shows that assumptions have become much more conservative already.
Overall it feels that much of the correction that has been necessary in the S&P 500 has already taken place. Which supports the positive market outlook from Wall Street banks mentioned at the beginning.
The Bad
There is a reason why analysts corrected down their earnings-growth expectations and that is an expected slow-down in US economic growth in 2019 as compared to previous year. So whereas 2018 US GDP growth is estimated at 3%, for 2019 latest FED forecast ranks at 2.3%. This cooldown for sure justifies a correction in analysts’ earnings expectations which they rightfully did.
The question just is, is the extent of the correction justified? To understand this, I took a short look on current average profitability and cost structure of S&P 500 index companies (find more on this here Business Insider). It looks like fixed costs of S&P 500 companies as % of sales are at around 25%. This indicates that a cool-down of US economic growth of around 0.7% translates into a reduction in earnings growth of approximately 4 times as much, i.e. 2.8%. Seeing that analysts corrected their expectations by arounds 10%, I surely think that they are, mildly speaking, on the conservative side here.
Therefore, the bad, i.e. projected economic cooldown 2019, does not look as bad as initially thought. At least most of it seems to be already priced into current stock market valuations.
The Ugly
Despite its current forecast of a cooling down US economy, the FED still holds onto its target of increasing the FED rate up to 3% in 2019. While the majority of analysts does not think this to happen at the moment and many actually expect a rate cut (see here Financial Times) the threat by the FED remains a major uncertainty to S&P 500 development. Combined with several political risks, such as the US trade conflict with China and the Brexit uncertainty in Europe, financial market volatility should be elevated in 2019.
To Conclude
Overall, my opinion is that we already saw a major correction of US and S&P stock market valuation in 2018. Thus, for 2019 I share the opinion of major Wall Street analysts that S&P 500 and US stocks should be expected to increase until 2019 year-end again. Market volatility, however, will be elevated and the road more rocky than it could be observed during the last years.
I hope you liked my post, please feel free to also visit my profile on etoro, where I provide the possibility to copy my trading activity based on my current market assessments!
![]()
Have a great CW2 !
Yours, Marius

